A Panel Conversation on Experimentation Program Goals
After dozens of conversations Experimenters from around the world, we decided to try a new format: a panel. The idea is to hear some of their opinions on a single topic from time to time so that we can go deep into a particular subject. We hope you enjoy it!
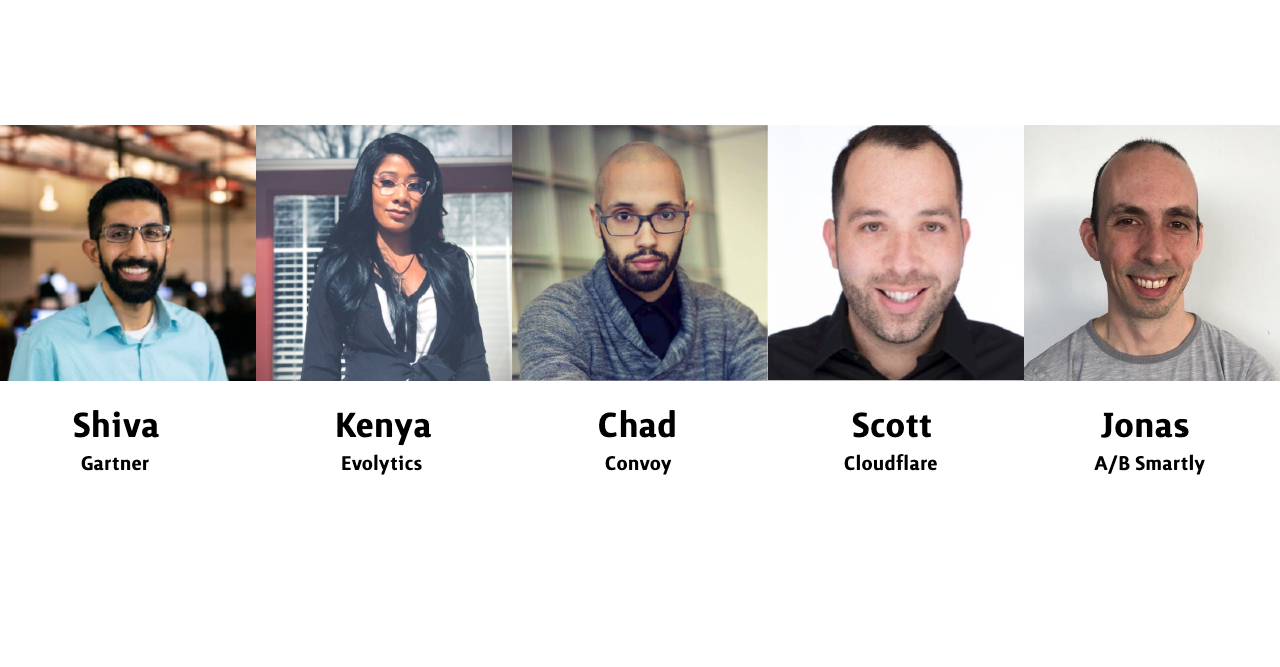
This month, we spoke to Shiva, Kenya, Chad, Scott, and Jonas about how they measure the performance of their Experimentation programs.
Rommil: Hi everyone, thank you all for taking the time to sit on our first panel! I wanted to try out a new format where we could dive deep into a single topic and get the perspectives from experts in this space. So, a topic that I thought could be very interesting for us to chat about is: How to measure the performance of an Experimentation Program. But before we start, let’s do a quick round table. If you folks could kindly introduce yourselves and what you do, we can go from there. I’ll start.
Hi everyone. I’m Rommil Santiago, I’m the Experimentation lead for Canada’s largest retailer and I’ll be leading the panel today.
Shiva:
I’m Shiva Manjunath, Program Manager for CRO at Gartner, and I’m glad I can get to talk with y’all!
Kenya:
Hello there, I am Kenya Davis, Sr. Manager, Decision Science at Evolytics.
Jonas:
Hi all. I’m Jonas Alves. I’m a Co-founder of A/B Smartly, an Experimentation platform that runs on-premises and I’m the former Product Owner of Experimentation at Booking.com.
Chad:
I’m Chad Sanderson, the current Head of Product for Data Platform at Convoy, and formerly a PM on the Experimentation Platform Team at Microsoft.
Scott:
Hi. I’m Scott Olivares, a product manager for Cloudflare’s website, www.cloudflare.com.
Welcome, all!
What are your thoughts on the importance of measuring a program’s performance?—?and we can go around from there.
Scott:
It’s important for all programs. Assuming that a program was created with a purpose, then there needs to be a way to determine whether it’s reaching that purpose.
Chad:
An experimentation program or platform is an investment by the business that expects to see some amount of return. Measurement is just as important as any other business unit that is required to justify their existence, budget, resources, etc. The difficulty in measurement for an Experimentation Platform team or any infrastructure unit is that to prove ROI we must go through a layer of abstraction?—?our customers use our tools to generate business value, and the quality of the inputs (experiment hypothesis, design, analysis) can be compounded by our efforts but not fundamentally changed.
Jonas:
It’s important to know what we are doing and if the efforts are getting better over time. That’s only possible with some kind of measurement. While I believe it’s essential to do it in the long run, I don’t think it’s necessary to have it right from the start. If the team believes in experimentation and it’s backed from the top it’s more important to just start doing it than waiting to have a way to measure it.
Kenya:
The success of your program will directly reflect the validity of your data and the potential success of your goals in digestible increments. It can also dictate if the generalization of your goals are simply good or bad. For a leader, the performance, however that is measured, will provide accuracy of the goal setting.
Shiva:
Measuring program performance is not unique to CRO, and it’s important to calculate ROI for the program in order to justify its expansion, or even it’s existence. CRO is in a unique place, where it’s actually a lot easier to understand the amount of revenue projected in rolling out a new version based on the lift to the control, but it’s also in a unique place because sometimes those lifts aren’t truly seen on the bottom line due to a number of factors.
“Assuming that a program was created with a purpose, then there needs to be a way to determine whether it’s reaching that purpose.”?—?Scott Olivares
Definitely. I like Shiva’s point about measuring a program’s ROI to justify its existence. And I totally feel what Chad is saying about how the layers of abstraction make it complicated.
With that said, what are your approaches measurement and could you share what you think is the most important KPI to track?
Kenya:
I like to break it up into 3 grades.
- Input of accepted tests vs output/deployment. This is agnostic of the outcome of the test and allows you to know how well your team is handling demand.
- Input (all requests) vs accepted, provides insight into whether the stakeholders are knowledgeable in testing practices. For example, someone sending a test that has either been done before or is based on opinion would/should be rejected. If it were submitted multiple times, it will tell you that the education of proper testing and the research of previous tests is not being done. Lastly…
- Inconclusive vs conclusive (this includes accepted hypothesis and rejected hypotheses). If there is a high inconclusivity rate in for example a particular domain, you may not know that space as well as you thought. There could be room to explore the data further to understand how confident you are in the future test cases.
Chad:
For an Experimentation Platform, I am less interested in ‘number of winning tests,’ as this is a function of good feature design/research and not inherent value provided by the tool itself (in most cases). ‘Time to Decision’ is one of my most valuable metrics. It covers the gamut of experiment design, to the physical run-time of each experiment, to the time it takes an analyst or data scientist to draw conclusions and even the implementation of new metrics or data pipelines. With a robust counterfactual in place, it’s possible to deduce the marginal revenue improvements for each test. For example, imagine that the average ‘Time to Decision’ for an experiment is 4 weeks: 1 week to design the experiment, 2 weeks for it to run, and 1 week for analysis. If the Experimentation Platform could determine the feature would contribute no significant value at the end of week 1. This saves 1 week of runtime plus 1 week of analysis time- both of which can be quantified. Volume is another decent metric (I’ve used this many times as a proxy for what the business really cares about) but Adoption is superior for safety. The more code deployments are covered by experiments, the more the business can choose to rollback harmful changes.
Scott:
It depends on the purpose of the program. If the program is to drive customer acquisition, then you should be measuring conversion rates such as revenue per visitor (for eCommerce sites) or MQL Rate (for B2B sites). If it’s driving product usage, then perhaps you should be measuring feature usage rate. What you measure depends greatly on the business you’re in and the purpose of your program.
Shiva:
I use a number of tests/quarter to track efficiency of my program. Given my ‘test and learn’ methodology, the raw amount of tests run a month is a good KPI to optimize for, because I’m technically learning something every test. It will be different for each business, but I also try to throw percent of disruptive/non-disruptive tests as a secondary metric to track too. If I only ran 5 button colour CTA tests in a quarter, I’d consider that a failure even though we may have technically hit our goal of tests/quarter. So quality of tests matters just as much as quantity.
“‘Time to Decision’ is one of my most valuable metrics.”
— Chad Sanderson
Unsurprisingly, there’s no unified way to measure a program. Scott’s on the money, I feel, in saying that it depends on the purpose of the program. I feel that’s the hardest piece to get everyone aligned on. Of course, I like Kenya’s measurement of the operations of Experimentation?—?that’s something we do at my company to identify bottlenecks. But I really find the ‘Time to Decision’ metric mentioned by Chad really intriguing. I love how it embodies the purpose of Experimentation. I definitely want to explore that in my own work.
Changing gears. There are a lot of terms in this space. But I’d argue the exact definitions aren’t consistent. I’d love to hear how you folks define “Win-rate”
Jonas:
I’m not sure I’ve used the term before. I would say it’s probably the rate of significantly positive experiments, on the metric they were supposed to affect. But there are a lot of other stuff that you could call wins. Like testing a bugfix that didn’t break the site. Testing removing the translations from the website were negative as expected and gave you the value of a translation.
Chad:
To me, Win-Rate is the fraction of features that product teams feel comfortable pushing to production over ones they do not. Many CRO’s see the word ‘win’ and think it only applies to business metrics like revenue or app downloads, but this is untrue. Multiple aspects of the Convoy app cannot be directly connected to measurable economic improvements because they are too upstream. However, failing to make these improvements due to lack of a clear revenue-based signal is choosing not to improve customer experience when all qualitative indicators are green.
Scott:
I think a win varies based on the situation. I’m happy when we run an experiment that proves that the variant we’d like to launch hurts conversion rate because we are able to avoid hurting ourselves. Similarly, if there’s a strategic reason to change something and you can prove that it has no impact, it may not fall into the classic “win” category, but it’s very valuable information. Ultimately, if an experiment is able to help you make an informed decision, then it’s a good thing.
Shiva:
‘Wins’ for a CRO program can be different, and not always be based on monetary output. Building on Chad’s point, non-inferiority tests can yield wins without necessarily directly driving revenue on the test. To tie ‘wins’ strictly to ‘how much money did it make us’ is not the right way to define win-rate. That being the case, I define wins as hypotheses being proven right.
Kenya:
Win-rate is an interesting way of putting it. I would say my short and sweet definition would be accuracy of accepted hypotheses rate. By understanding analytics and consistently observing customer behaviour, your hypotheses should become more fact-based and easier to measure at high confidence levels.
“Companies should invest in making experimentation super cheap.”
— Jonas Alves
A lot of places that are held in high regard in this industry boast very high test-velocities (i.e., the number of tests run per period). What are your thoughts on the number of tests a program should run, and how do you balance between quantity vs quality?
Chad:
The ideal number of experiments run should be equal to the number of deployments. This is the only way to guarantee business safety. Having a tremendous number of experiments isn’t much extra work: Engineering teams have by and large adopted feature flags as the defacto production deployment mechanism, measured feature flags (Experiments) are simply the next stage in a natural evolution.
Jonas:
I agree with Chad. Companies should invest in making experimentation super cheap. It’s not that difficult. If every single change is tested velocity increases dramatically. Deployments and releases become completely decoupled which reduces risk and fear of deploying. Then the number of experiments is the number of code changes and that is proportional to the number of teams/people working on the product.
Scott:
I think it depends on the cost of running tests. Some companies, like LinkedIn, have a very robust in-house testing platform with great reporting, tons of engineers, and enjoy an incredible amount of traffic. Running experiments there is fast and cheap?—?so they run a ton of them and are able to be very data-driven. It’s part of their culture and product managers are expected to test/ramp everything. Other companies don’t have as much traffic, or don’t have the resources to test everything. Therefore tests are much more expensive, take longer and can slow down the business. I don’t think a company like the one in my second example should set out to run a lot of tests. They should focus on running fewer experiments with a big impact.
Shiva:
‘Higher quality tests’ usually have a higher level of disruption to revenue (and usually a higher time to develop the test), so it’s not always in the business’ best interest to always run disruptive tests. Lower quality tests (i.e. less disruption) tend to give you more cleaner insight as to things that are working (or not), as it’s likely isolating more individual variables?—?however, they usually tend to not drive as much revenue gains as a disruptive test. So, balancing ‘learning’ with ‘disruption’ is the best way to think about how to win with this. A program running 50 button colour tests a month isn’t worth boasting, but running 1 disruptive test a quarter also isn’t worth boasting either. Balancing the building of complex/simple tests, and the execution of those, will help you drive a strong CRO program.
Kenya:
I personally loathe the concept of competitive testing quotas. What works for your business is exclusive to your business. Quality of tests are independent while quantity is dependent. I’ll explain. Quality is based on the data streams with high percent accuracies and credible interpretations. Quantity is dependent on technology velocity AND can move forward without quality data. Basically, you can run a 1000 tests a year that mean nothing. I’ve heard of companies running mass numbers but due to these high numbers, their customers have never seen a “real” version of their site. These phantom experiences are extremely hard to measure. You would have to measure the rate of inconclusive results while measuring the high converting experience combinations. Don’t get me wrong, quantity will always matter and will lead to more confident conclusions. Relationships to successful experiences are not completely 1:1 to tests. It does take multiple attempts at different vantage points to articulate and address the customer’s needs sometimes.
“…balancing ‘learning’ with ‘disruption’ is the best way to think about how to win with this.”
— Shiva Manjunath
I definitely hear what you’re saying, Kenya. I’m not a huge fan of quota metrics either. They can be gamed very easily and don’t focus on what matters, learning and impact?—?as Scott suggests. I also love the concept of creating a balance between “learning” and “disruption” as Shiva mentioned. With that said, getting stakeholders to agree on the balance is challenging as well.
Obviously, plan as we may, big events occur that force us to course-correct and make adjustments. How should leaders in this space, those who lead Experimentation / CRO programs, account for global events like COVID-19? Or should we even be running tests now?
Scott:
It looks like I’m going to be the “it depends” guy. But, it depends! Every business is different and has a different objective. Some are trying to maximize business value today. Others are making strategic moves that may not help the business in the short term. For example, my employer, Cloudflare, offers a product that makes it possible for remote employees to access their company’s network without a VPN. Our leaders made a fast decision to give it away for free for at least 6 months. We did not run a test and it wasn’t even discussed. We are responding to a huge global event, and are doing what seems like the right thing to do. Other companies, like Walmart.com or Disney+… I hope they are testing the heck out of their pages because the stakes are high and they should try to create the best experience for users.
Shiva:
I’m actually running COVID-specific testing right now and seeing some success. If you have the financial backing to run tests (meaning, there is the ability to have some tests lose), go for running tests! Your audiences for your sites likely have changed, and I’d start digging deeper into session recording/heatmap/analytics tools to see exactly how user behaviour has changed, and lean into that.
Kenya:
YES, you absolutely should be running tests during this time! However, your teams should be sensitive now to the KPIs that indicate the emotion of the customer. The timeline of events should be a spectrum that is paralleled with data to understand areas where the analytics spike or drop. Additionally, run some empathetic campaigns to boost relevant products/services. Now is the time to address, in a crisis how do your customers “need you”.
Jonas:
If you are changing code you have to test. But you should be careful at extrapolating those results after the crisis. It will take months before we are over this, so I would say you should be testing for the current situation. And when we are over this you should run tests for the new situation.
Chad:
Yes, we should still be running experiments though how we interpret A/B tests require situational awareness. For example, imagine I have started an experiment that tests whether or not increasing the number of notifications per hour a user receives affects their auction bid rate. Due to economic uncertainty, fewer bids are placed meaning my results may not generalize to the broader population. However, there is a bug in this particular feature that prevents a landing page from scrolling if there are too many unread notifications on a particular browser type. Experimentation can catch the bug (so long as I’ve instrumented the page appropriately) in a way human beings can’t. That value add does not change regardless of the world-changing around it.
I’m with you folks. We are continuing to run Experiments at my company—?but accounting for the change of behaviour/demand has added a layer of complexity for sure. I like how Chad phrased it. We require “situational awareness.” And as Jonas mentions we should be very careful about extrapolating.
One of the key components of a successful Experimentation program is solid documentation. How do you document your experiments and what tools do you use to do so?
Shiva:
I personally use Airtable to manage the program, which all have links to Google Sheets for each individual experiment, and lots of data points for each individual experiment (audiences tested, devices tested, start dates, etc.). There are a lot of excellent roadmap tools out there, though. You can likely get away with a simple spreadsheet, as long as it’s available for everyone to access an up to date version of it in real-time.
Kenya:
Previously, I’ve used a combination of confluence and JIRA. The tool in which you document is not the piece that matters. What matters is the consistency, accessibility/maintenance, and what exactly is captured. I like to make sure the site’s environment is captured to understand the need for the test. That can be a combo of User research, pre-analyses, session replay links and market trends. There could also be technical strategies and related tests documented as optional content. You have to format it in a way of reading a story supported by unbiased, technically structured facts. Meaning, you should leave out the “I think”, “maybe”, “really/very”, “extremely” etc. vocabulary.
Jonas:
I believe all the documentation belongs to the experimentation platform. It’s fine to have the roadmap in Jira, Google Sheets, or whatever works for you, but all the documentation, discussion, results and reports belong to the platform. There you can search it quickly, dice it, get automate reports and use the learnings to follow up experiments.
Chad:
At Convoy, data scientists do a write-up in Google Sheets for every experiment completed. Each A/B Test is given the same credence as a scientific document. On the Experimentation Platform side, this sort of manual reporting is something we’d like to automate in the future.
Scott:
We have our experiment roadmap in Google Sheets, which doubles as a place to document the results of every experiment. This Google Sheet then feeds into a Google Data Studio dashboard where you can see every experiment that was launched or completed at any point in time, as well as their locations and results.
“…you should leave out the ‘I think’, ‘maybe’, ‘really/very’, ‘extremely’ etc. vocabulary.”?—?Kenya Davis
I know I’ve struggled with this mightily. We use Confluence and Google Sheets mainly. But ensuring that everything is filled out properly and consistently has been tough. I too have been exploring ways to automate a lot of this. I like the point that Jonas raised though, search is ultra-important. Documentation is useless unless we can search it effectively.
“Experimentation should be completely transparent inside the organization and the tool should broadcast all changes, decisions and results.”
— Jonas Alves
Senior leadership often wants to know how an Experimentation is performing. How often do you report to leadership and what do you share?
Shiva:
Usually once a week, I pull results and share ‘statuses’ of tests. Expected end of results, high-level takeaways of ended tests, next set of test launches, etc. The contents of the presentation vary depending on the audience though (CMO vs. program managers vs. VPs of engineering).
Kenya:
As desired, but at a minimum monthly from a high level. Each document can have three sections. Leadership (how does this test support the primary goal and what is the ROI), Marketing (high/low converting customer groups, identifiable attributes, trends, and supplemental tests to continue telling the story), and lastly Product/Tech (Technical strategy/setup and other tests in flight that could have impacted results.)
Jonas:
Experimentation should be completely transparent inside the organization and the tool should broadcast all changes, decisions and results. If this is in place there’s no need to report anything. But I would say that it’s probably nice to summarize the biggest learnings and results once a quarter.
Scott:
We have an Experiments chat room where we post every experiment launch and completion as they occur. Then my team sends out a more detailed monthly recap every month to supplement the experiment dashboard I referred to in the previous question.
At my company, we definitely leverage Slack channels to share learnings, we also distribute a weekly digest, some lines of business review results every month, and we often have Experimenters share their work to the company whenever possible. But it’s always challenging to get people’s attention when there is so much going on, at least for us.
Finally, it’s time for the Lightning round!
The term “CRO”. Love it or hate it?
Kenya:
Hate it.
Jonas:
I only learned about the term 3 years ago, and I have been doing this for more than 10. I don’t care about the term, but I never use it.
Chad:
Hate it.
Scott:
If what you’re trying to do is just optimize conversion rate, then it’s fine. If you’re doing more than that, then “CRO” is too limiting.
Shiva:
Tolerate it. It’s not the perfect descriptor, but it’s not inherently wrong depending on the person’s actual job duties.
To me, I find the term CRO is often used by marketers?—?though I could be wrong here. I’m not the biggest fan of it either?—?but I don’t have a better term.
Your biggest peeve in this industry?
Jonas:
Shall we test this or not?
Chad:
Using experiment results as forecasts (if they aren’t true predictive metrics).
Scott:
“How long is this experiment going to last?”
Shiva:
‘Best practices’ for web design. I think there are ways to say ‘this thing we tested works for us, you should try it,’ but the way people throw around, the assumption being made is that you should just automatically do those things without actually testing it.
Kenya:
Tests run because a leader “said so”.
I think if I had any peeve, it’d be around statistics and forecasting. Pulling folks back from expecting certain results based on a test is a constant struggle. Hmm… I should hold a panel just on this. I feel it’d be interesting.
Finally, on a scale of 0 to 10, how strong are your statistics-skills where 0 is having no idea, and 10 is your consider yourself strong enough to teach at a university?
Chad:
6.
Scott:
Between 4 and 6. That’s all I ever need. If I need to do something more complicated, then I can just read one of Chad’s posts.
Shiva:
5/10. Could be better, but definitely strong enough for my needs within my program.
Kenya:
Wow, a university? 5.
Jonas:
4. When I need something more advanced I ask Georgi.
I feel, based on what I know about the Dunning-Kruger Effect, that I’m either heading towards or exiting the Valley of Despair. So I’d give myself a 4 as well.

However, you’re all a 10 to me!
Thanks, everyone for joining the conversation!
Connect with Experimenters from around the world
We’ll highlight our latest members throughout our site, shout them out on LinkedIn, and for those who are interested, include them in an upcoming profile feature on our site.
Related posts:

- Don’t rely on macro goals with Gursimran (Simar) Gujral - July 26, 2024
- Navigating Experimentation at Startups with Avishek Basu Mallick - July 18, 2024
- People are the biggest challenge featuring Michael St Laurent - July 13, 2024